
Decline curves sound technical. They are not. They are simple patterns that show how wells produce over time. If you own royalties or mineral rights, this pattern explains almost everything you see on a statement.
The problem is most people do not learn it early. They see a strong first payment. Then a drop. Then another drop. It feels like something went wrong.
It did not.
You are watching a decline curve do exactly what it is supposed to do.
Table of Contents
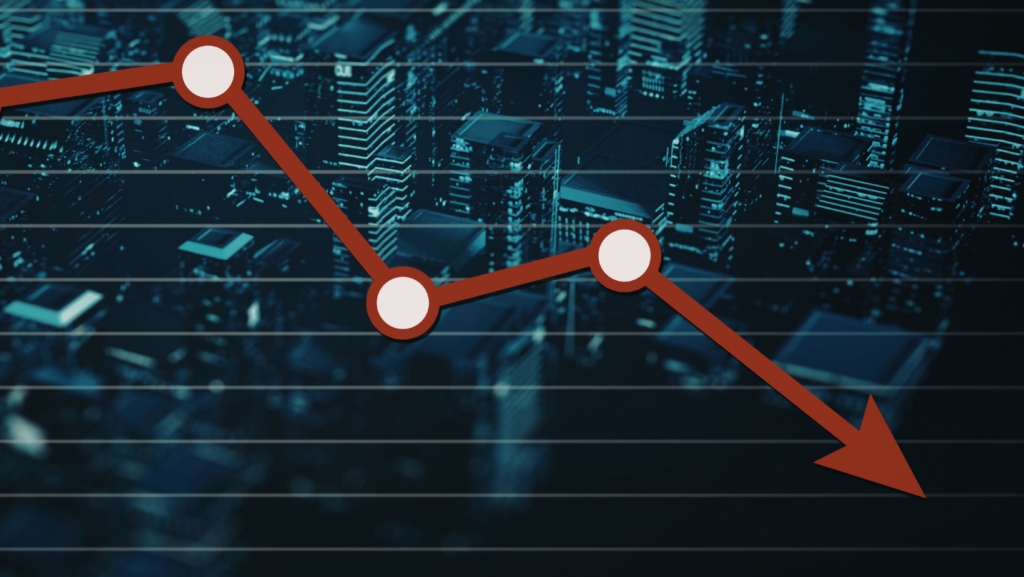
ToggleWhat a Decline Curve Actually Shows
A decline curve tracks production from a well across time.
Most shale wells follow the same shape:
That shape repeats across the U.S.
The U.S. Energy Information Administration shows many shale wells decline 60 to 70 percent in the first year. That number surprises people. It should not.
A mineral owner once said, “My first cheque felt like a bonus. The second felt like a mistake.” It was neither. It was the curve.
Why the First Year Feels Misleading
Early production is loud. Pressure is high. Flow is strong.
Then pressure drops. Production falls. Payments shrink.
This creates confusion.
A field operator explained it during a site visit. “We tell people the first six months are the sprint. The rest is the marathon.”
If you expect a sprint to last forever, you will always feel disappointed.
The Long Tail Is the Real Story
The early drop gets attention. The long tail creates value.
After year one, decline slows. Production stabilizes. That stable phase can last decades in some basins.
A landowner in Oklahoma said, “The big cheque got my attention. The small cheques paid my bills for years.”
That is the role of the tail.
It is not exciting. It is reliable.
Decline Curves Vary by Basin
Not every well declines the same way.
Different basins show different patterns:
Local geology matters.
Teams like G2 Petroleum texas learned early that nearby wells tell a clearer story than national averages.
A geologist once said, “If you want to know your future, look at your neighbors.”
How Decline Curves Affect Your Payments
Royalty payments follow production.
As production declines, payments decline.
This creates three phases:
Phase 1: Early surge
High production. High payments. Short-lived.
Phase 2: Adjustment
Sharp decline. Payments drop quickly.
Phase 3: Stability
Slow decline. Smaller but consistent payments.
A mineral owner shared, “Month three worried me. Year three made me calm.”
Understanding these phases changes expectations.
Why Decline Curves Reduce Anxiety
Stress comes from surprise.
Decline curves remove surprise.
When you know:
You stop reacting emotionally.
A drilling supervisor once said, “The well is doing its job. The problem is expectations.”
Technology Does Not Eliminate Decline
Modern drilling methods improve early production. Longer laterals. More stages.
They make the first part of the curve bigger. They do not remove the curve.
A completion engineer said, “We made the first year louder. The rest stayed the same.”
That insight matters.
High-tech wells still follow natural patterns.
Common Mistakes Owners Make
Many mistakes come from misunderstanding decline curves.
Mistake 1: Thinking something broke
Most wells decline exactly as expected.
Mistake 2: Comparing month to month
Short-term swings create noise.
Mistake 3: Selling after the drop
That is when stability begins.
Mistake 4: Ignoring local wells
Nearby performance is the best guide.
Mistake 5: Expecting straight lines
Production never moves in a straight line.
Actionable Ways to Use Decline Curves
You do not need advanced tools. You need simple habits.
Track production quarterly
Quarterly data smooths out noise.
Plot basic charts
Use a spreadsheet. Watch the slope change.
Compare wells within 10 to 20 miles
Local patterns repeat.
Plan based on stable output
Ignore early spikes when setting expectations.
Review once per year
Frequent checking creates stress.
A landman once said, “If you check every week, you’ll worry every week.”
Why Decline Curves Support Long-Term Thinking
Decline curves reward patience.
They show that early drops are normal. They show that long-term production matters more than short-term spikes.
A ranch owner explained it clearly. “The first year got my attention. The next ten years built my confidence.”
That shift in thinking changes decisions.
Decline Curves and Family Planning
Mineral rights often pass between generations.
Decline curves help families plan across time.
Early production may fund immediate needs. Mid-life production supports stability. Long tails provide ongoing support.
A family in Texas shared, “We thought it was a short-term asset. It turned into a long-term one.”
Understanding the curve helps align expectations.
Final Thoughts
Decline curves are not warnings. They are explanations.
They show how wells behave. They explain why payments change. They reveal where long-term value lives.
Once you understand the curve, confusion fades. Patterns replace panic.
A veteran geologist said it best. “If you understand the shape, you stop fearing the slope.”
For royalty and mineral owners, that understanding is powerful. It turns uncertainty into clarity.